Back in 2011 things were not looking good for developer tools in Firefox. Firebug development had slowed and its lead developer took a job with Google after IBM lost interest in funding his work on the project. Mozilla was already working on moving debugging tools into Firefox core but the new dev tools were pretty uninspiring compared to what Chrome had. Myself and pretty much every other developer I know eventually ended up using Chrome for development work, which eventually translated into using Chrome all the time.
Well, I’ve been spending more time in Firefox lately, and am happy to see Mozilla has been rapidly closing the gap with Chrome on the dev tools front.
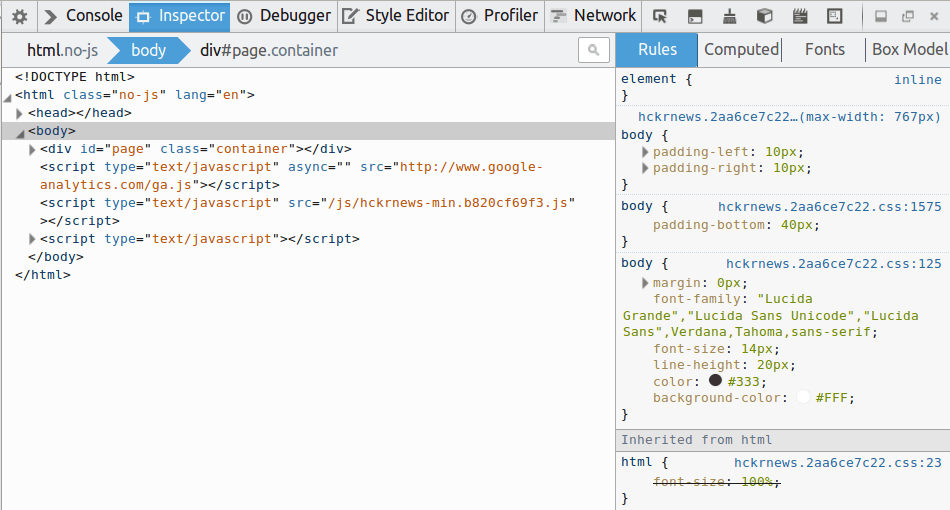
One of the major frustrations with the Firefox dev tools was removed with Firefox 29’s new ability to disable the cache. Strangely there does not seem to be a way to set this permanently (it’s forgotten each time you close the dev tools!), but at least it exists.
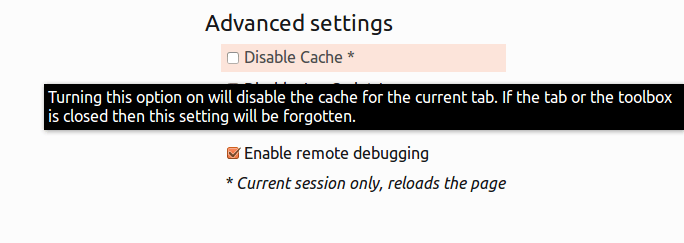
The challenge of the dev tools is in presenting a huge amount of information to the user in as compact a way as possible. After working with the Firefox dev tools a little it feels like the focus is less on piling in features trying to match Chrome and more on clear presentation of the essentials. “Clarity over parity” I suppose you could say. This approach is really visible if you compare the Network timings in Firefox and Chrome:
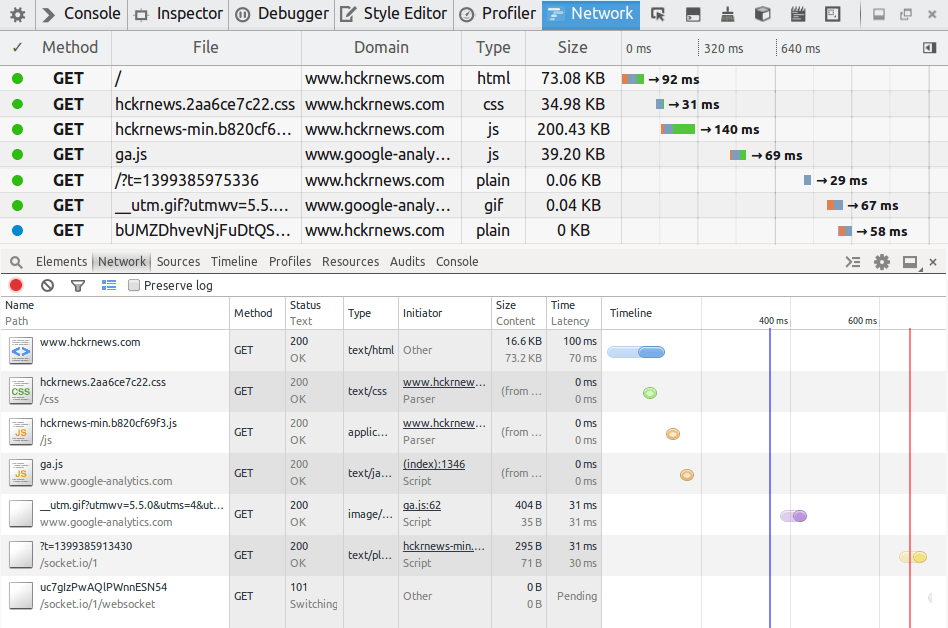
The network timings from Firefox (top) and Chrome.
I think its far more clear in Firefox that the total time for a request is the sum of a few different times (DNS resolution, connecting, sending, waiting, receiving), while its really not clear what is going on in Chrome until you start digging.
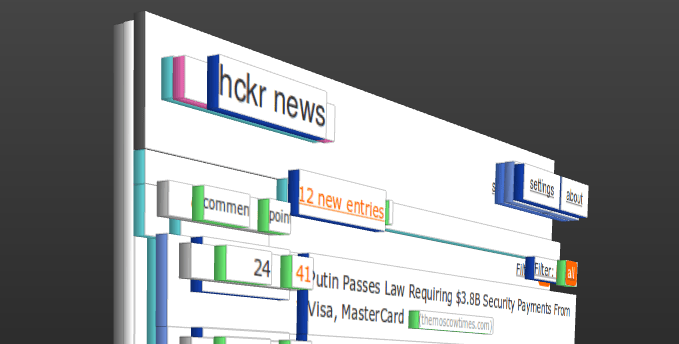
One thing I was happy to notice was that the famous Tilt addon has been moved into core and incorporated into the dev tools (update: 3D View now needs to be enabled in the settings).

While this might have been written off initially as a WebGL Demo or a bit of a gimmick, I think its super useful for finding and eliminating unnecessary nesting of elements so I am really glad to see it find a home here.
The dev tools also feature a responsive design mode which allow you to simulate arbitrary screen sizes. While the responsive design mode is really nice, I really like to be able to debug pages live on my phone. Fortunately Mozilla has made that possible by using the adb tool that the Android SDK provides. On Ubuntu you can install it from the repos:
mike@sleepycat:~☺  sudo apt-get install android-tools-adb
Setting up android-tools-adb (4.2.2+git20130218-3ubuntu16)
...
Then you will need to enable remote debugging in your Firefox mobile settings:

With that done you should be able to see the mobile browser in the adb’s list of devices:
mike@sleepycat:~☺  adb devices
* daemon not running. starting it now on port 5037 *
* daemon started successfully *
List of devices attached
0149B33B12005018	device
To connect run
adb forward tcp:6000 localfilesystem:/data/data/org.mozilla.firefox/firefox-debugger-socketand the choose Tools > Web Developer > Connect… from your Desktop Firefox’s menu. It will bring up a page like this:
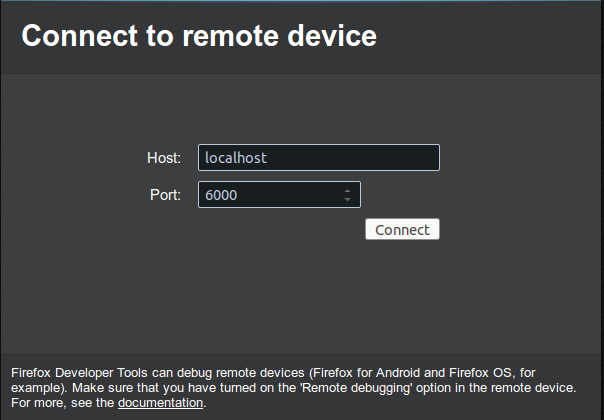
When you click connect you should see this on the screen of your mobile device:

While the dev tools are still missing a few features I like from the Chrome dev tools (mostly being able to get a list of unused CSS declarations), all my day to day use cases are well covered. In fact, while I rarely used network timings before, the clearer presentation of them has made me realize how much valuable information was in there.
Its been good to dig into these tools and find so much good stuff going on. It feels like there was a bit of a rocky transition from Firebug to the new dev tools, but clearly Mozilla has found it’s feet. I’m looking forward to exploring further.